Retail – Staff Turnover and Knowledge Management

This blog was written by Joe Williams

In this series of blogs, we are looking at what rising costs could mean for the Retail industry in 2023 and sharing some useful tips on where you can begin to look for cost savings.

Staff turnover and knowledge loss prevention are key challenges within the Retail industry. In fact, it has one of the highest staff turnover rates. A whopping 60% are considering leaving their jobs in the next few months and only half are looking to stay within the sector. Although this problem is widespread within the industry, the pain is often most acute when there is in particular a lack of training in place for new employees and few standardised processes. 

So how can we mitigate this problem? – First consider employee satisfaction. Retailers need to offer competitive salaries and working conditions. Most retail workers expect some flexibility in their schedules and the latest technology to support their success. Once you are confident that you have a competitive job offering, it’s a good idea to consider your onboarding process and how you train new members of staff. 

Are you confident that you have a set of processes new employees can follow, or are they taught on the job?

New employee training and ongoing regular staff training are crucial for business success. This is even more pertinent in the Retail sector that has high staff turnover. Maintaining efficiency in business operations is an ongoing battle. Knowledge management tools should be in place to ensure that everything is documented, repeatable and scalable. Not only does this help ensure compliant business operations, but it also helps to create the ‘training manual’ for an organisation. We shouldn’t expect staff to know how to do everything. We should be providing them with an up-to-date source of information/process library that they can refer back to. understand and follow. 

After all, we are all creatures of habit. It is often the case that the knowledge of how best to do a particular task is not well documented. Perhaps it’s only ever done by a single person. As soon as that person leaves the business, costs are often incurred by having to train new staff. Or the knowledge is lost and someone has to rework the whole process entirely.

Having a central process library that everyone can understand, provides a single source of truth for the organisation to leverage. This keeps everyone on the same page and minimises the disruption caused by staff turnover. 

Creating diagrams of business processes that can be understood by everyone – from the floor worker to the CEO is essential. Skore is a simple yet powerful process mapping and improvement tool that connects processes with roles, systems, costs, time and videos or documentation. It also leverages the easy-to-understand UPN methodology. Enabling users to create a multi-layered process library. A valuable asset for knowledge management and reducing unnecessary costs. 

If you’d like to chat about how Skore can help you have better knowledge management, or just find out more about the platform, please get in touch [email protected] 

3 Reasons You’re Falling Behind with Business Process Management.

Business Process Management success is not an unattainable goal, you just have to make the correct adjustments. 

Have you been working on business processes since the pandemic but still not seen much engagement or adoption from your organisation?

Or worked with experts and still remain confused as to where the value lies?

Then this blog is for you.

Here are three reasons why you might be falling behind that you should consider.

Lack of Standardisation 

One of the biggest headaches when it comes to business process management and business process mapping is standardisation.

And this starts from the very beginning of an understanding of your processes.

Take your mapping notation. If your business’ notation is not standardised, then no one is on the same page.It’s like reading the shorthand of someone who mapped out a process with pen and paper fifty years ago, and disagreeing now if what you are reading means deliver or receive. 

There are different ways to map out your processes, flowcharts and swim lane diagrams to name a few examples. Similarly, there are different ways to approach completing those processes, such as BPMN.

The overwhelming issue, however, is the lack of standardisation. Mapping diagrams and BPMN leave too much open to the interpretation of each individual either reading or mapping the process for the first time. In the case of BPMN, there is also the need for studying too many additional symbols and signs. Over time, this will only become a problem as different iterations of workers in the same role may understand and reinterpret certain parts of the process differently. 

It is in this search for standardisation from the get-go that Skore was based on Universal Process Notation (UPN). A notation that is easily understood and which leaves no room for re-interpretation, it is the cornerstone on which you can begin to standardise all of your processes. No more inaccuracies or uncertainties when running workshops, analysing your data, or training new hires. 

Furthermore, with Skore your team will be more engaged than ever.

This means you may discover differences in how different workers perform tasks in different locations, as well as unnecessary tasks or paperwork being completed that are time-consuming and serve no purpose. Because you have no standardised process in place, you will run across these scenarios constantly as you are studying your processes.

To find these spots, it is essential that you map out everything in real time as faithfully as possible, and talk to all involved parties. After all, they are the ones completing these steps on a daily basis. 

Based on what you find, you can then make the appropriate changes to each process that best fit. Once you have a master process in place, you can begin to examine your behaviours throughout the company.

It’s easiest to do when you first start mapping out your processes, but it can always be revisited over time, and it should if you want to keep improving. After all, new technology or methods are always available, so continuously re-visiting and re-standardising your existing processes is key to success.

Standardise your business processes from day one, and your business process management will be a success. 

Lack of Clear Responsibilities 

Another major hurdle for business process management is a lack of clarity when it comes to roles and assigned responsibilities.

If there is any uncertainty regarding who is responsible for approval or for finishing a certain step, a process will grind to a halt and move at a glacial pace. This inefficiency is the last thing you want, as it will negatively impact the rest of the business.

There should be complete transparency and clarity regarding which role is responsible for what tasks, and what they look like. The best way to overcome any uncertainty is to assign a role to each step so it is really clear.

Other options for mapping out your processes present responsibilities in a typically confusing addition. At Skore, we knew how important this aspect of a process map is, so we include it right below the activity box, and we base it on a person’s title. After all, an employee may leave, but the title will remain.

Additionally, we recommend RATSI notation as a way to further ensure a quick understanding of the role a title plays in the process. RATSI stands for:

  • Responsible – who is the person making sure the activity is done satisfactorily enough to move on to the next part of the process, typically a manager or director figure.
  • Authority – ultimately, who is in charge of the activity or decision should anything need to be elevated, usually not your everyday worker, more of an executive.
  • Task – who is actually doing the activity, your everyday frontline worker. 
  • Support – a support figure that can provide input in particularly exceptional situations or cases, for example, a subject matter expert (SME) being invited to a sales call to support the sales team. 
  • Informed – someone who is informed when an activity or task is completed, whether successfully or not, most likely someone that is part of your analytics team.

In Skore, when you are assigning a role to a task, you will see these letters next to the role, providing a wider picture of what their involvement may be. You can also look at role descriptions and the similar tasks those roles fulfill to double-check that the role being assigned a task is correct. You can use any responsibility matrix you like for example RACI, RATSI etc. 

As Skore is a collaborative tool, everyone involved in a process can then see who is responsible and contact them directly or ask them for guidance if needed. This is especially important for retaining knowledge as well: new hires can access the process library during training and ask the correct person questions, and so can company leaders when evaluating processes.

Skore is also capable of providing a bird’s eye view of this to make sure everyone is completing their tasks through its Quantify analytics.

Lack of Good Quality Analytics 

Business process management involves decision-making, and to make the best decisions, you need data.

A business process map is extremely useful, as are the conversations that arise during the mapping process, but you cannot know the exact effect your change will have without having access to numerical data. And even then, if your processes are delayed, you may be missing out on key data necessary to truly make decisions.

If you’re slow, then your stakeholders will be even slower. After all, you need data to convince them to make a change, and that data will be studied closely by them. Anything that may not add up will result in questions and a further slowing down of the entire process.

Access to immediate, high-quality analytics is absolutely crucial for business process management success.

Fortunately, Skore has Quantify.

Unique to Skore, Quantify allows you to input all your processes and data into the platform before running all of the analysis that you may need. As soon as all the information is in, you will have a dashboard with all the relevant data displayed, plus delays, costs, and spots for improvement highlighted.

With Quantify, you can study your process data quickly and determine where you want to try to improve. Once you’ve found those areas you can then also run an analysis to see what making a change will look like in the future. The platform will take into consideration your capacity and help you understand what is possible as well.

Based on different scenarios, you can then select which one is best for you to move forward with. The Quantify feature will then help you create a business case for change that you can present to your stakeholders. With this data readily available, you will significantly cut down on wait time for approval and be able to enact the changes as needed confidently and securely in your decision. 

When building Skore, we were well aware of the necessity for quality data and analytics to achieve business process management success. Quantify is a testament to this awareness, and we are proud of its unique capabilities and how it has helped our clients across the board.

Business Process Management Success is in your grasp.

Business process management success requires dedication and work, and it must be continuous.

With the right tools, however, a lot of it can become significantly easier.

One such platform is Skore, designed specifically for business process mapping and management in mind.

If you’re determined to meet and exceed your business process management goals this year, we’re here to guide you.

Get In Touch With Our Team

3 Difficulties of Assigning Roles & Responsibilities Without RATSI 

One thing you need for your business processes to run smoothly?

An awareness of who is responsible for what and when, in your processes. 

In other words, clearly defined roles in the process and their associated responsibilities.

At Skore, we’ve made it a point to include this important aspect of business process mapping in our platform via the RATSI framework, which is a bit different from RACI. It stands for assigning the responsibilities based on:

  • Responsible – who is the person making sure the activity is done satisfactorily enough to move on to the next part of the process, typically a manager or director figure.
  • Authority – ultimately, who is in charge of the activity or decision should anything need to be elevated, usually not your everyday worker, more of an executive.
  • Task – who is actually doing the activity, your everyday frontline worker. 
  • Support – a support figure that can provide input in particularly exceptional situations or cases, for example, a subject matter expert (SME) being invited to a sales call to support the sales team. 
  • Informed – someone who is informed when an activity or task is completed, whether successfully or not, most likely someone that is part of your analytics team.

The reason why we focus so heavily on roles and responsibilities in our platform is that if it’s not done properly, organisations suffer.

Let’s take a look at why.

Difficulty 1: Accepting Sign-Off 

One of the most common causes of a business process bottleneck, signing off can sometimes end up being a game of hot potato when it comes to responsibilities. And can be what slows everything down

If it is at all unclear who is responsible for what activity in your process, things can come to a standstill, and your business will suffer for it. 

The clarity in signing off and the steps associated with it is essential and needs to be incorporated into your process as soon as possible. With Skore, we make it easy for you to do so.

Each of our activity boxes has a Who? space at the bottom of the box to assign the correct title to the activity. Next to each title, you can also assign a RATSI (or any other responsibility matrix) letter, to indicate the type of role they have within the process. This helps ensure that it makes sense and that several bases are covered as needed per task. 

Additionally each title, or role, has a set of responsibilities and activities that align with the activity which is easily visible, either when you’re building the process, analysing it for improvement, or studying it as part of training. 

Without a RATSI framework, knowing who is in charge of moving the process along via approval can be extremely difficult to pinpoint. 

Other forms of mapping such as swim lane diagrams or flowcharts do not place as much importance on the visualization of the responsible role for each process task. But this is because they were not created with business process mapping in mind.

For business processes to move along, certain roles must be made responsible for certain tasks. Otherwise, people are difficult to pin down and could refuse responsibility for a process step, slowing everything down and affecting your efficiency as a company. Understanding the responsibilities of a role and transparently communicating them in a map is a necessity for business processes to run smoothly.

When building Skore, we recognised this limitation in other forms of mapping, and sought to fix it. This is why we use Universal Process Notation (UPN) to avoid confusion, and why we employ the RATSI matrix. You cannot shirk responsibilities when they are clearly shown next to your role and your role is highlighted as responsible for a necessary task to move the entire process along. 

If you do not use Skore or our notation or matrixes, you are most likely struggling with obtaining approval and being slower than you could be. 

Difficulty 2: Required Compliance & Risk Overviews

With the rising need for compliance and risk overviews throughout various industries, it is imperative for businesses to know who is responsible for ensuring that they are falling within the correct guidelines.

Any slowdown in being able to be sure that the necessary steps are being taken will negatively impact any business. 

If you’re in tech, where everything moves fast, you are probably feeling this heavily right now.

Cybersecurity has never been more necessary, and there are new regulatory standards to adhere to constantly. The amount of changes you are making to comply with the new standards to mitigate risk, and the speed at which you are trying to make them, is probably new to you. But it might also be something that is slowing you down significantly.

With new measures, your workers may be unsure who is responsible for approval, or the responsible party may be difficult to track down. Especially if your processes aren’t mapped and available to relevant team members.

In a worst-case scenario, if you’re in food and beverage, it can actually lead to perishable products being lost. It would be due to the amount of time wasted without having a clear idea of whether you are complying with laws. And this, of course, results in a significant loss of revenue that you then have to compensate for out of pocket.

All because you didn’t know who was supposed to be in charge of the risk and compliance overview. 

With RATSI and Skore, you can move past this concern.

Workers can refer to a process map and find who the correct role should be for approval in this situation. Even when things are changing fast, extrapolating the information as you build a process is quick based on their existing tasks and the RATSI matrix.

If you’re unsure, you can also utilise Quantify to study who is approving the quickest in different areas, and plan your process accordingly.

Above all, transparency regarding responsibility is key when workers have to find the right approval for risk and compliance changes. 

Difficulty 3: Knowledge Retention 

Finally, without RATSI, knowledge retention becomes nigh on impossible.

Our clients have greatly benefited from this aspect of Skore over time, and it is why we have written so much about the importance of process libraries.

While employees come and go, and processes can change, it is imperative for a business to hold on to that information. Without information on how a process is being done at this particular point in time, it becomes impossible to analyse processes for improvement and train new hires.

But even that becomes difficult if RATSI is not implemented and used by the organisation.

RATSI allows roles and responsibilities to be assigned thanks to a pre-determined matrix, and Skore has simplified it even further so that the role is the focus, and its particular capability is highlighted. 

If you are studying a process map to improve or optimise it, or you are preparing to train new hires, you need to know what role has what responsibility within the process. New hires can then learn who to ask for help, and you know who you can ask for further details on a process if you’re looking to make positive changes.

Additionally, it helps to keep the knowledge within the company and be passed down, and potentially duplicated if the company grows.

Without RATSI, you only end up with half the information you need to truly improve or train. 

Conclusion 

Assigning roles and responsibilities is a key component of any business. It is especially important when it comes to business processes, since if you do not know the correct person to turn to for questions or approvals, a process will stall.

Skore recognised this importance, and so when it was being built, roles were incorporated directly into the mapping process.

Skore focused on  UPN because it knows the importance of a role for an overall process to be it’s most efficient. And when it was looking to recognise this and improve on it for anyone interested in their business processes, Skore also started recommending the RATSI matrix.

Without it, knowledge of who does what becomes a bit more difficult than it needs to be.

If you’re looking to speed up approval times or fully understand who is responsible for what in your company, you’ve come to the right place.

Our team is ready to help you gain control of your business processes, simply get in touch

Get Started Today

How to Measure Business Process Improvement

It can be hard to truly see the effect your changes are having on your business until a lot later.

You might be cutting costs on what you discover is the wrong thing, or you might be overspending on a tool that is not truly worth it, even if it seems like it is.

The best way to tell if your changes are having any effect? Numbers.

To truly arrive at business process improvement, you need to pay attention to the numbers and measure it constantly.

Let’s dig into how.

What Is Business Process Improvement?

Firstly, let’s understand what is meant by business process improvement.

We’ve written about business process optimisation in the past, a practice focused on efficiency and cutting costs above all.

Business process improvement is similar, except the end goal is to arrive at overall success. Cutting costs is more of a side effect than a final goal of the re-engineering process that takes place.

The concept of continuous process improvement has become the norm that most companies strive for.

Essentially, you are continuously studying and analysing your process to make them as efficient and successful as possible. Everything a client is paying you should be reflected in the various steps of your process for it to be worth it. 

Anything extraneous to this can be studied and improved upon, such as wait times, resourcing locations, certain tasks, or documentation. 

Everyone involved in your business, from top to bottom, should be aware of how the work they do impacts your business goals. By involving them directly, you can ensure that you have folks constantly thinking about how they might do their job better.

While at first, this may seem simple enough, it is trickier than you might think. A business process map to help you visualise how your business is working thanks to software such as Skore is just the tip of the iceberg.

Importance of Analytics for Business Process Improvement 

It should go without saying that analytics and numbers are incredibly important for business process improvement.

But what type of analytics might you use for improvement purposes? Here are some examples:

Firstly, you can use analytics to improve employee productivity and engagement. By studying your workers workflows and patterns, and engaging with them, you can learn how to best serve both them and yourself. You can boost morale and productivity as well.

Secondly, streamlining operations becomes easier than ever. Without certain KPIs or results to study, it is difficult to truly and conclusively find spots in the process where you feel confident a change will lead to positive results. It’s one thing to have everything mapped out for visualisation purposes, it’s another to also have the corresponding necessary data available to make a decision.

Thirdly, you can track consumer behaviour and improve their customer experience. There is a breadth of data and analytics available regarding consumers that businesses can use to improve customer-facing processes, by personalising their experience, and therefore improving customer satisfaction.

Fourth, based on this same data, and by additionally monitoring changes in the market or industry, businesses can now launch a new product or service confidently. By studying their data, they will know what will appeal to their existing target base and potentially be appealing to a new one. If they’re already changed their existing processes accordingly, they can replicate them and utilise them in this process as well.

Fifth and finally, you can ensure your decision-making is data-driven, which is key for getting stakeholders on board. Sign off is significantly longer from stakeholders if you cannot provide them with explicit, numerical evidence for why you are making those changes. Your processes and improvements would no longer stallwhen it’s time to make the big decisions.

Evidently, then, analytics is quite an important aspect of business process improvement, and a useful one for measuring how you are doing. 

But how can you obtain those necessary numbers? 

Introducing Skore’s Quantify 

The good thing about Skore is that, besides providing you with an easy-to-use, collaborative business process mapping platform, it also has Quantify to help you have those numbers ready a lot faster. 

Both for current analysis and for hypothetical changes, Quantify will provide you with the data you need based on your inputs into the tool. 

Quantify will help you:

  • Identify hidden costs and bottlenecks in your process: based on your process maps, Quantify will discover any step that may be costing you time and money. Notably, these tend to be moments such as wait times during approval steps, but no stone goes unturned with the analysis of the information you have inputted. You will have conversations regarding how long certain steps are taking with your workers, and you will be continuously surprised at how many of these opportunities you might have.
  • Understand the impact of changes: finding these hidden costs and bottlenecks will result in coming up with changes to overcome them. Quantify will help you map out what those changes could be, and how they could impact the process as a whole, so that you are aiming for the best solution.
  • Create a business case for change: as mentioned previously, analytics are a great way to convince stakeholders to agree to making those changes a lot quicker. Quantify will serve this purpose by providing you with the data and information you need to present to your relevant stakeholders in order to make that change happen.
  • Calculate the cost of a service: if you are working with a client that is continuously asking for more or asking for something specifically, Quantify can help you quickly calculate how much that service should cost and how much you should charge the client for it.
  • Understand your capacity: you may be looking to expand, or to make significant changes to your process. To do it successfully, you have to have an idea of what resources you have available. Quantify will help you understand your capacity and not exceed it, and adjust your changes according to it.  
  • Explore different potential scenarios: this allows you to replicate your process for months or years at a time, so that you can see how that change would affect your potential ROI. If there is a wait time at any step, it may look smaller up close, but once expanded to a year, how much are you actually losing out on? Quantify allows you to see that instantly and thus make a more informed decision when it comes to improvements. And it allows you to see how it would change as well.

How Does Skore Quantify Work?

Utilising Quantify with Skore is extremely easy. It can be narrowed down to four key steps:

First, you want to map all of your processes in Skore. You can do this online, independently, or in real-time workshops. As Skore is a collaborative platform, everyone can contribute in their own time or in real-time. 

Thanks to its base being UPN, all of Skore’s notation is fully standardised, avoiding any misunderstandings which may arise by using other mapping software. This means everyone can contribute without the need for additional knowledge. 

Once you have all of your processes mapped in your process library, you can begin to add numerical information such as durations, direct costs, delays and people costs. With Skore, you can add as much information as is necessary to fully provide a realistic picture of what your processes look like. And it does not clutter your map one bit.

With the information added, Skore will begin running its initial analysis. You will find dashboards with all of the data you provided instantly and readily visible, showing the durations of your processes and potential bottlenecks. This will also help you understand costs and how successful you are at matching process activities to revenue. 

Finally, you can begin to explore and consider your options. Understand the impact your changes will have by exploring different scenarios. Once you’ve settled on the best one based on your current understanding of your capacity, you can create a business case to present to your shareholders.

If you’ve already mapped all of your processes and have been using Skore for a while, you can also utilise Quantify to continuously improve on your existing processes. Set up a process review to remind you to constantly check your analytics to study how your improvements are going, and to find new steps to improve as well.

Conclusion 

Business process improvement is measured most easily numerically. And the way to access those numbers?

Have your analytics reflect your processes.

Skore is unique in its offer of Quantify, which can speedily help you stay on top of the data on a continuous basis, a key component to achieve business process improvement.

Get in touch with our team to find out more!

Get Started Today

Retail – Supply Chain, Packaging & Delivery Cost Savings

This blog was written by Joe Williams

In this series of blogs, we are looking at what rising costs could mean for the Retail industry in 2023 and share some useful tips on where you can begin to look for cost savings.

Rising costs are affecting retail businesses throughout their supply chain and operations. Mapping out and visualising an operating model for your retail business is a great way to investigate areas under a business’s direct control. However, costs and time are also accrued on your behalf outside of your organisation, through third-party suppliers. Getting visibility of your supply chain and how it operates can also allow you to spot improvement opportunities in areas of stock management, sustainability and delivery time. 

By investigating your supply chain you may be able to leverage better deals with your supply partners and achieve joint efficiencies in your operations. It may also give you a compelling reason to investigate potential new suppliers. Tidying up your supply chain will often create further stability, whilst also saving you money on the procurement of stock and/or supplies. For example, sourcing from local suppliers may now be more attractive, compared with larger international partners, due to higher shipping costs and taxes. Sourcing locally could also be a key differentiator as more people look for more sustainable retail alternatives.  

Look at Packaging Choices

The vast majority of retail businesses are now online and many have large shipping and packaging costs. Packaging is often an easier place to start. It is within your direct control and changes have a lesser effect on the main business operations. Materials and technology have moved on in recent years and there are now more sustainable and cheaper alternatives to plastic and bubble wrap. Don’t forget, however, to consider the type of packaging that your specific product(s) needs so they arrive safe and in perfect condition to the customer. Remember that first impressions and customer experience are vital to winning repeat business and customer loyalty in Retail. 

Shipping is an important part of most retail businesses. It is often outsourced to a national or international fulfilment partner. They can cover both shipping and warehousing costs in one single monthly payment. Customers shopping online now expect fast deliveries, so it is important to research and compare the speed, quality and cost of your shipping partner to their competitors. Visualising shipping operations is a useful way to understand the differences in lead times and feedback/support processes. By taking the time to review these simple aspects of your businesses you can not only make some easy changes but also discover some incredible opportunities for your organisation. And it shouldn’t be difficult to do. 

Use the Right Tools

Skore is a purpose-built process improvement platform. It is helping retail businesses map their supply chain and operations faster and in a format that everyone can understand. Sharing process maps with suppliers and third parties is easy within Skore, making collaboration around improvement opportunities much more efficient and effective.

If you’d like to chat about how Skore can help you map your supply chain, or just find out more about the platform please get in touch [email protected] 

Looking for a RACI Alternative?

There are RACI alternatives out there that can help you. In this blog we’ll explore your options plus you can get access to our simple guide on how to apply these different methods to your Process Improvement Initiatives.

Do you need a clearer way to analyse roles and responsibilities in your organisation?

Struggling to find an effective method that gives you the data you need from the information you put in?

    Free Guide to How to Use RATSI in Process Improvement

    We’ll examine how to tackle the vagueness of RACI that so many of us find so confusing and demonstrate easy ways of digesting the information, especially in large and complex documents. If you need a RACI alternative then read on to discover more.

    Fixing the RACI terminology confusion

    Let’s start by tackling the terminology… As a reminder RACI stands for 

    • Responsible
    • Accountable
    • Consult 
    • Inform

    We use RACI to give everyone a level of responsibility in each activity. The point is that it should then be clear what is expected of everyone working on that activity. However, the truth is that often we have different views on the meanings. Especially the difference between Responsible and Accountable. 

    In this RACI blog we explain why we think Responsible is the person who does the majority of the work and Accountable is the person who owns the output of the work – like the director or process owner for example. 

    However lots of people might disagree with this. In addition, for international companies, there is the added challenge of being lost in translation. Responsible and Accountable can mean the same thing in other languages. Which can lead to much confusion!

    There are a number of RACI alternatives that correct this issue and our favourite is RATSI. 

    RATSI as a RACI Alternative

    RATSI stands for: 

    • Authority – “owns” the activity or the decision to be made. Clearly not involved in the day to day work.
    • Responsible – for ensuring the activity is done (not necessarily doing the work but ensuring it is completed to an agreed standard).
    • Task – actually does the work as described.
    • Support – provides inputs in exceptional situations / edge cases (otherwise it would be Task).
    • Informed – is informed the activity will happen / has been done (successfully or not!).

      Free Guide to How to Use RATSI in Process Improvement

      RATSI is our favourite because it stops the vagueness and confusion. In RATSI, R is still Responsible but it means the owner not the doer. The doer is T (Task) and A (Authority) is for the person who takes go/no go decision

      Tools for applying RACI or RACI Alternatives

      Common Tools for RACI

      Like any tool, software for capturing, analysing and sharing RACI information should make our lives easier. Of course the purpose of RACI is to actually clarify roles and responsibilities for everyone. The truth is that often the activity makes things even more confusing and leads to frustration. 

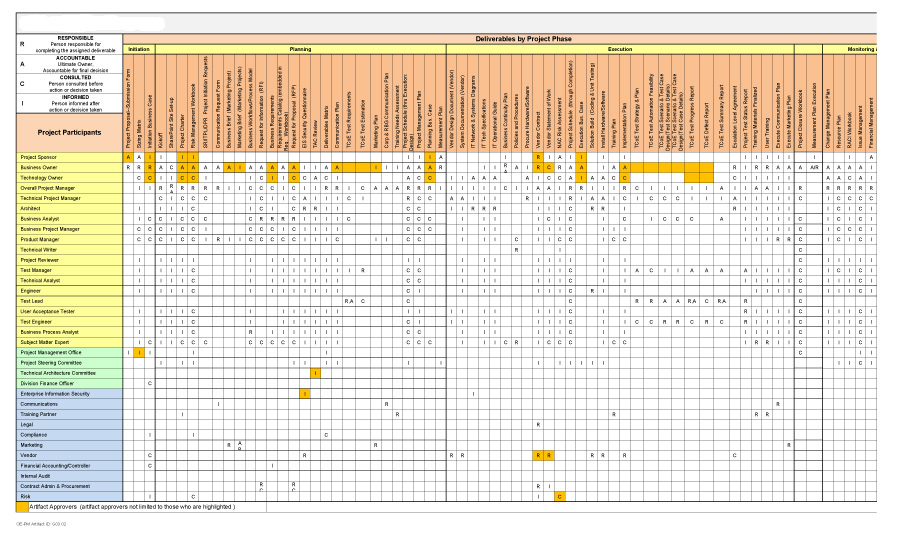
      Often we see that RACI charts are represented as a Matrix. Roles are listed along the X or Y axis and key activities along the other. Where the two intersect is where you record the responsibility level – R,A,C or I. 

      The idea is that for any given role you simply follow the row (or column!) for that role and it shows the varying levels of responsibility for each activity. Or you can select an activity and look at the matrix to see who is involved. Spreadsheets can be used for this type of grid and therefore RACI matrices are often produced in Excel or Google Sheets. Some project management software products also have a RACI matrix capability as well. Drawing softwares such as MS Visio can also include templates for making a matrix although they can be harder to manage and update when things inevitably change. 

      Skore, the Process Improvement platform was designed to handle RACI matrices and below we’ll explain in more detail how it can help you solve your RACI/RATSI queries. 

      The main problems with common RACI tools

      While creating a RACI matrix in something like Excel seems straightforward, actually it has a number of problems which means people search for a RACI alternative. How often have you spent days creating a matrix to find that no one ever looks at it again? Or worked hard to craft a detailed spreadsheet only to be told that it’s still too confusing to understand everyone’s roles and responsibilities? 

      If this is you, have you considered that a matrix rarely exists without a process diagram alongside it? And that the activities represented in the matrix are generally part of a wider process. So it makes sense that the team really needs to understand the process in the first place. 

      However often we create the process as a separate document and it’s referenced separately. Or the team hasn’t understood the process. It makes sense that activities in the matrix are going to be pretty unclear in that case. Even worse if there are lots of detailed activities it will lead to an enormous matrix which is impossible to read. 

      A large and complex RACI Matrix in Excel

      SKORE – an easy, simple way to capture and understand RACI or any responsibility matrix.

      Skore was designed to incorporate simplicity at every level. The process improvement platform uses UPN – the easy process mapping language designed to be understood by anyone in your team. In Skore every time a user assigns a role to an activity they assign a responsibility. This means that the team can focus on one activity at a time and agree on the responsibility level together.

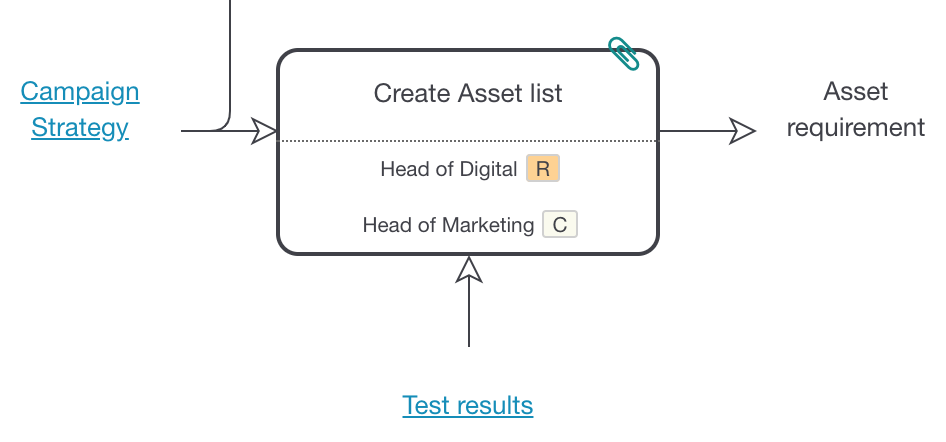
      RACI Alternative - RACI tags on a process
      Roles are tagged with RACI when added to an activity

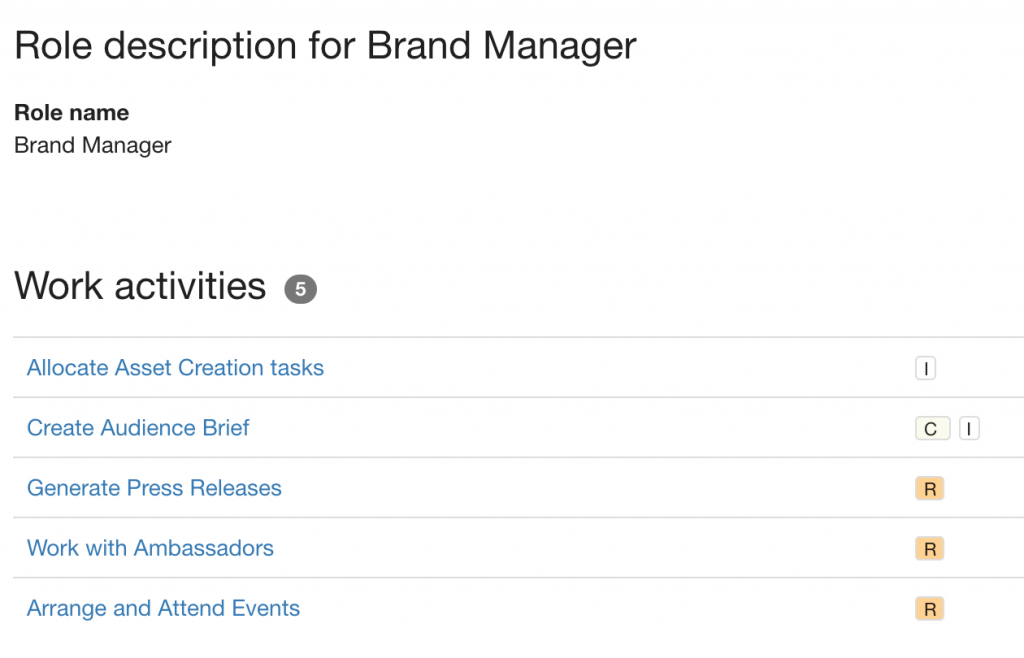
      So while you map a process in a workshop, Skore automatically creates role descriptions. These show the activities of each role as well as the responsibility level. If you’re using a RACI alternative, Skore supports models such as RATSI and RAPID or allows you to create your own custom model.

      RACI Alternative - Role Descriptions
      A simple role description showing RACI tags

      Easy to Read Matrix

      Even better, Skore effortlessly creates a simple RACI matrix using the Reports tab. Plus, if you prefer, it can be exported to a spreadsheet when needed.

      This means one of the main benefits is that you store a visualisation of the process alongside the RACI information, rather than having two separate documents. Plus, Skore links the information so updating the process means you are also updating the RACI information and vice versa.

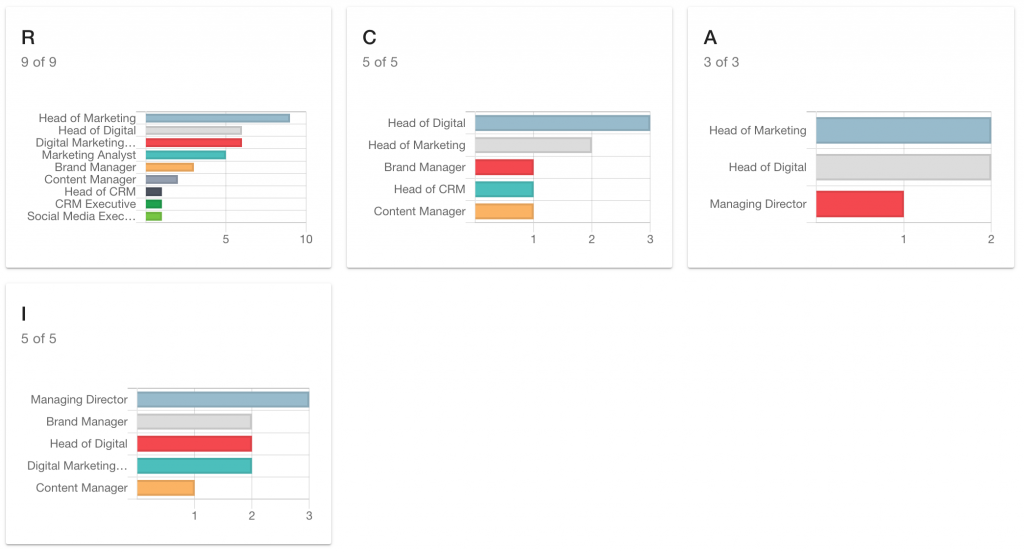
      Many companies also use tools such as RACI for organisation design. Either if they are are designing completely new processes, or transforming existing processes. In this case RACI helps to design new roles in the organisation. The Skore platform’s powerful analytics help you determine whether you have the right balance of responsibilities across the team.

      RACI alternative - visualisations
      One of various visualisations that help with role design

      It can even help you model scenarios to understand how many people you need to run the process, based on their responsibilities.#

        Free Guide to How to Use RATSI in Process Improvement

        Conclusion

        RACI is a powerful tool for helping teams to clarify roles and responsibilities but it comes with a number of challenges. This results in people looking for a RACI alternative. To find the right solution first evaluate the specific challenges you face and try to identify what the true issue is. For example, if it’s because you are suffering confusion and vagueness around the RACI acronym then look to use an alternative such as RATSI.

        If you are struggling with an overly complex matrix or a lack of understanding from yourself or your organisation, then re-evaluate the tools you are using in the first place. It could be that Skore is the solution given that it combines the power of simple process mapping with RACI and analytics. If you’d like to find out more about how we can help you then get in touch with the team below. 

        Why Do I Need a Business Process Library?

        In our top trends of 2023 for business process improvement article, we highlight that companies aiming to remain on top of their game will be looking to build their own process libraries this year.

        After all, as companies seek to cut costs and optimise in an uncertain world, they must understand their existing processes more than ever.

        Enter the need to standardise processes and build a business process library to achieve it.

        What Is a Business Process Library 

        We’ve gone over it before, but a business process library is essentially a repository of all of your existing business processes. Typically, these have been mapped and are saved in the mapping software you’ve used.

        Ideally, you are able to access this process library whenever you need, so that you can study your existing processes for improvement, optimisation, training, or knowledge-keeping for future endeavours or new verticals.

        Simply keeping lists of the steps you take every day to run your business is no longer enough. Having your processes visualised and saved in this way instead of in someone’s head is extremely beneficial to your business in the long run.

        How Does a Business Process Library Help My Business 

        Having a business process library helps your business, for the same reason you map your processes to begin with.

        To study and understand your business and what it takes to run it.

        If you do not know and understand how your business accomplishes its day-to-day activities or how those activities contribute directly to your revenue, your business will suffer, and you will not be successful.

        Success means that you’ve taken on the idea of continuous improvement, which is the idea that you should seek to enhance your existing business processes over time to achieve more efficiency.

        Mapping your processes helps you find the places in the steps you take where you can implement a change to achieve this improvement over time, and test out different paths to achieve it by mapping it first.

        But mapping is also instrumental for optimisation, which refers to re-visiting your existing business processes and finding places where you are overspending or otherwise losing out on money.

        The goal of improvement is efficiency for client satisfaction and growth, whereas optimisation is focused on cutting costs and finding redundancies. 

        How does this play out in real life?

        Anything from winning back a week of time in discovery to saving on 80 days worth of waste thanks to going through the task of mapping out your business processes is possible. Other examples of what you can find through mapping are redundant tasks, out-of-date documentation, or loss of time due to material sourcing that can be cut down.

        And all of these spots and steps are found thanks to visualising your processes via a map with a platform such as Skore

        Skore additionally can help you locate these spots thanks to our unique analytics. Meaning not only is it easier than ever to map your processes, but the tool also helps you quickly find the spots for improvement or optimisation based on numerical data.

        And Skore helps you build a business process library within its software.

        In the past, mapped processes would be easily lost. And this was because they were often made with pen and paper or built on basic diagramming software that was out of date as soon as it was written. 

        Finding previously mapped processes meant digging through filing cabinets or papers that were lost after long workshop sessions. Additionally, handwriting and the forms of notation associated with them opened them up to misinterpretation constantly.

        Not to mention, keeping them updated was a headache and a half, as by the time it was time to revisit them they would be heavily out of date. Assuming you could remember how you had preserved them.

        Instead, creating a process library via software where you can keep all of your existing processes is useful not only for your improvement or optimisation needs, but also as a knowledge repository for future workers and team members.

        You can use it for training for new workers to constantly refer to during the first few months of work. They learn the tasks expected of them according to the current processes and over time can provide insight into what works or doesn’t work.

        Additionally, should you begin to explore new verticals or contemplate opening multiple locations, these same processes can be used and replicated in your other locations as your start off.

        By taking the time to build your business process library, you are able to:

        • Align the company and its processes to focus on company goals without overspending or having redundancies
        • Understand your current situation and how it plays out on the ground, keeping track of your business
        • Communicate with stakeholders the status of your business
        • Keep all the knowledge that you have created in one place for future use for employees or yourself when growing
        • Identify possible growth opportunities

        And the software to help you do all of this is Skore.

        Why Skore Is the Best Software to Build a Business Process Library 

        The first thing to understand is that, as mentioned above, if you do not use software to map your business process today, these are already out of date as soon as you publish or share them.

        Business process mapping-specific software such as Skore exists to help businesses keep on top of their processes at all times, as we are cloud-based. This need for constantly updating and compiling processes is what led our software to exist.

        And we’ve taken on this task with gusto.

        With Skore, not only can you map your processes easily, but speedily as well. 

        One of the main concerns of process mapping workshops in the past was how time-consuming they were. Even the software that has been adapted for process mapping in the past, such as Visio, made it slow as building shapes and connectors would also take time.

        Not so with our tool, as its main purpose is process mapping and improvement.

        Our user-friendly interface is expressly made for simple process mapping, meaning everything  is already there for you to simply plug information into. This speeds up the process during the workshop, allowing you to obtain stakeholder sign-offs a lot faster, making everything more efficient.

        This is because we based our software on Universal Process Notation (UPN).

        This makes it easy for everyone involved to follow along and contribute, from stakeholders to frontline workers, without the possibility of misinterpretation of any kind. UPN ensures clarity for process maps, which is why Skore is based on it, as our motto when it comes to mapping is clarity and simplicity.

        The less crowded a process map, the better.

        And the subprocess feature, viewable for example in our sample customer onboarding process map, is one of the ways in which we ensure process maps are clean, but not at the expense of important information.

        Skore allows customers to drill down to all parts of a process, including the most detailed of steps that form part of other processes, thanks to UPN. Other forms of notation will exclude information at the expense of keeping the map clean, but with subprocesses, your maps remain clear. You do not lose out on any parts of the process, allowing you to have a full picture.

        Our reviews feature also reminds people to check and update the processes they are responsible for, ensuring that your processes are constantly up-to-date and accessible to anyone that is responsible for them.

        Skore focuses on responsibility assignment based on the roles assigned to certain actions.

        In this way, we are also helping you preserve knowledge as the actions associated with that part of the process are attached to the role, not a person. You do not lose the knowledge when the individual with the role moves on.

        Finally, Skore provides a unique analytics feature for you to run on your process maps.

        You can build your processes and keep them updated and preserved on your library, and also run analytics on them to find places for improvement and optimisation. With this feature, instead of having to have long discussions to find the spots you want to work on or change, the software will find it for you based on numerical data.

        It makes it all much more efficient and faster, as does all of Skore for the entirety of process mapping.

        Conclusion 

        Process libraries allow you to preserve the knowledge of your business and keep it updated, so it can be reused for future optimisation, improvement, training, or expansion needs.

        They’ve become possible to preserve thanks to software such as Skore, which keeps everything in one place and offers additional features such as subprocesses, analytics, and process reviews.

        Ready to start building your library?

        Get in touch!

        Alternatives to Lucidchart

        In the world of process improvement, many options are available if you’re looking to trade in your pen and paper for software.

        We’ve already noted that this switch will be a trend in business process improvement this year.

        Lucidchart is a popular choice but there are some alternatives available. In this blog we’ll give some initial guidance into Lucidchart and also explore what other software platforms are available to you with the pros and cons you need to know before making your decision.

        Lucidchart: An Overview

        Lucidchart is an intelligent diagramming application that focuses on helping users understand the people, processes, and systems that help run their business. Often, it can be connected with spreadsheets or other documents.

        Not to be confused with Lucidspark, which can also be found on the application, and is intended for freeform ideation and group brainstorming, taking the form of a whiteboard.

        On Lucidchart, you can select from a variety of templates to then map out your processes. They include flowcharts, swim lanes, and BPMN charts. These are useful as you have a starting point from which to base your process map, and it is similar to other tools users may be familiar with as well, making it a user-friendly option. 

        Additionally, you can invite teammates to your maps by clicking the share button. Other information, such as spreadsheets or links, can also often be added to your maps, as users have noted.

        However, Lucidchart does have limitations.

        Firstly, you are relying on pre-made templates that you have to move around to fit your needs. Secondly, you cannot select multiple objects within these templates at once. Thirdly, depending on your price point, the number of objects you can insert into your chart may be limited as well. Finally, users also commented that mixing templates and objects may end up actually confusing you as you build your map.

        Overall, while Lucidchart seems to be a great tool for brainstorming and dipping your toes into the world of process mapping, it aims to do too many things and thus fails to help focused users build the best process maps they can.

        So let’s take a look at some alternatives.

        Alternatives to Lucidchart

        We’ll be comparing Lucidchart to the much-used Microsoft Visio in the process mapping world and to our own tool here at Skore in nine components we consider key for process mapping.

        Diagramming Tools

        If you’re first starting out, you might be thinking you simply need a diagramming tool, which both Visio and Lucidchart provide.

        Some people have even gone so far as to create organisational diagrams on power points!

        However, all of the editing is manual and it is only a starting point for any type of process, as it is not specific at all. This means that during a process mapping workshop, you may lose time creating new conditions and adding shapes to your map. 

        Skore’s tool focuses on the act of process mapping itself and the simplicity needed to do so in a way that is clear and communicative. Using a simple system limited to two shapes so as not to cause debates when building the map, our product supports multi-layered map models. 

        And it is meant and designed to map at the speed of words so that it can be used during workshops. The idea is to map simultaneously as ideas and information flow without needing to spend time building a shape and a connector.

        Standardised Approach

        Without standardisation, it is highly likely your notation meaning will change over time. This will result in confusion and lost knowledge, as you have too many diagramming options to choose from with both Visio and Lucidchart.

        Not only do you have to create entire diagrams exactly as you need them, but even while doing so, you will be contributing to confusion later down the line. There will be a severe lack of standardisation when it comes to notation and the meaning of your maps if you rely on simple diagramming tools.

        Even with the notation templates available in Lucidchart, since they will not be process specific, you will face challenges.

        With Skore’s reliance on Universal Process Notation (UPN) and singular approach, multiple users will always capture and communicate information in a standard and consistent way. This means everyone can read and understand your maps in the way you intended them to be.

        Integrated Data Model

        On both Visio and Lucidchart the data must be added manually to the diagrams and shapes to capture the additional information a step might need. Often this will make your map difficult to read or result in missing key information.

        Skore stores all relevant information within its basic map models and templates, as it knows the type of data that is needed to fully visualize a business process. 

        Roles, responsibilities, systems, requirements, and other forms of data can be accessed, stored, and integrated within one of our maps. Without causing confusion to the overall sequence of events, but accessible with a simple click.

        Multi Level Processes

        An important aspect of process mapping is the multi-level processes or processes that have an action or step that requires a previous process to be completed. How to display this on a process map and still keep it simple has been a struggle in past iterations of process mapping.

        On Visio and Lucidchart, multiple process diagrams can be linked together manually via the use of hotspots and linked shapes. However, this clutters maps and makes them difficult to understand without the appropriate knowledge. Often, information will go missing.

        With Skore, users are able to access multi-level processes and zoom in and out of the details. It does not clutter the map but creates separate pages users can access to drill down into a different level of the process to have a full picture. An example is our sample customer onboarding template, as clicking on the Perform initial setup box takes you to another page that details the steps required.

        No information is missing, and the maps remain clutter-free and easy to understand.

        Content Management

        It is not possible to manage content directly on Visio, but Lucidchart does automatically create a history of the revisions on a diagram. This allows users to track the changes made to a process map. There is no built-in approval or version control, however.

        Skore does provide the possibility of both viewing the revision history of its process maps and sending versions for approval to the prominent shareholders and company leaders, and it does so quickly. It may even be sent and approved within a singular workshop.

        Sharing and Collaboration

        Visio is part of Microsoft, so sharing and collaborating can get a bit tricky. Diagrams are shared as individual Visio files, or they can be shared online via Sharepoint or Office365. This is not always ideal as you may deal with clients or data that is not Microsoft-friendly.

        Lucidchart and Skore both focus on sharing content through browsers, either anonymously or securely to specific users.

        This is a more preferable solution for true collaboration as it eases the process and does not require contractors or third parties to be given access to sensitive information or time spent on file conversions instead of worthwhile collaboration.

        Reporting and Analysis 

        With Visio, data can be exported to Excel to then perform further analysis. 

        Lucidchart is similar, except it takes the file type of a CSV.

        Skore specifically provides a dashboard within the application that performs analysis and offers insights directly within it as well. It helps point out spots for improvement based on data, and can also be exported to a CSV or Excel file if needed to share with team members.

        User Management and Security

        Visio simply does not offer this feature, but Lucidchart permits user and group management from an administrative panel. Charts and diagrams can be shared with a team via different users or with Single Sign On. Team folders can also be created to help manage content, as Lucidchart is focused on creating a collaborative environment.

        Skore is similar, with user and group management specs available including Single Sign On. Instead of folders, you can create collections to manage your teams and projects securely, ensuring only the necessary people are involved with each process map.

        Look and Feel Customisation

        Finally, the documents you create need to reflect your company.

        While with Visio you can add logos and images to the documents you create, Lucidchart takes it a step further by creating Master pages that allow them to provide templates for individual customers. This does depend on the subscription price you are paying, of course, but it allows users to personalise the experience.

        With Skore, you go another step forwards.

        On our tool clients can create templates for their processes as well as stylesheets, and customise the application interface to match their branding.

        Everything they create thus retains the knowledge and spirit of their company when it comes to process management so that they can reutilize it and revisit it as they see it whenever they go into their process library for training, workshops, or even to brainstorm with their own clients.

        Conclusion

        There are other software options out there, such as Triaster, Nintex Promapp, Draw.io, yEd, and more. 

        At the end of the day, however, the reality is that Skore was built with a specific purpose in mind: business process improvement.

        It does not offer diagramming as a whole, which results in a lack of standardisation, nor does it use notation types that will leave out key information.

        Skore studied existing options and process mapping needs and was created to keep things simple, clear, fast, and accessible for workshops to find improvement spots.

        Ready to begin your journey with us?

        Get Started Today

        Top 5 Reasons to Use Skore as Your Business Process Mapping Software

        Are you ready to move on from pen and paper or basic diagramming tools?

        Fed up with overly complicated process languages and confusing symbols?

        Ready to make the plunge into business process mapping software?

        You’re probably shopping around right now, learning about all the different software available in the market right now.

        More than anyone else, we’re your best fit.

        Don’t believe us?

        Here are five reasons why Skore should be top of your business process mapping software list.

        Use of UPN 

        Skore is based on UPN, Universal Process Notation.

        Unlike other forms of notation for business mapping, such as BPMN, it does not require extensive study. It also focuses on keeping the maps simple and legible while presenting all aspects of a process. There are no concessions made like there are in Swim Lane diagrams, for example.

        UPN is easy to understand and for all company members, regardless of the level of expertise or knowledge, to follow. The process documentation becomes standardised easily, as the maps made with UPN ensure everyone in the company has the same understanding, avoiding misinterpretation entirely.

        This makes it possible to reuse the same material to train new hires and keep the organisational architecture and training aligned with the company goals. And when the time comes to review processes for improvement, they can be easily accessed and understood via the process library.

        Furthermore, CRM giant Salesforce has recently recognised the growing trend of analysts and companies relying on UPN to map their processes. On their online-training platform, Trailhead, under the Business Process Mapping course, there is now a module on UPN. UPN is what the future looks like for process mapping. 

        With Skore, you’ll be ahead of the curve compared to your competitors.

        You’ll be able to communicate clearly with both stakeholders and frontline workers about what your processes currently look like, what you want them to look like, and how you envision getting there. And everyone involved will be able to understand how it should play out.

        Faster Business Process Mapping 

        Traditionally, business process mapping workshops were complicated and time-consuming events that few employees wanted to attend. Everything was written with pen and paper, and that information took forever to compile in a way that made sense to then work on.

        Keeping it all up to date after the fact as processes and documentation changed was even more difficult as information would go missing or employees would move on.

        And after a workshop was over or when any change needed to be made to a process, getting sign-off from stakeholders would take weeks of chasing after them.

        Thanks to the adoption of UPN, business process mapping has never been faster with Skore as your tool.

        Mapping during workshops can be done remotely or in person, and it is considerably faster to create diagrams. As Skore is intuitive and built expressly for mapping, you also do not have to dedicate time to creating shapes or connectors. The tool already knows to do it for you. You can map your processes at the speed of conversation. 

        Sign-off from stakeholders can happen during the meeting, you can quickly create new processes or alternative processes to test out, and you can save all of them for future use or revisit. 

        Nothing is lost due to time or inattentiveness during the workshop, and you’re mapping faster than ever.

        Subprocesses 

        Skore has the feature of creating a subprocess within a process.

        What does this mean, and how does it look?

        Essentially, in a What box (which answers the question of what action is being taken at this point), you can link to the previous process required for that box to exist. 

        For example, in our sample customer onboarding template, there is an arrow-down button on the Perform initial setup box. Clicking on that takes us to the subprocess required to complete that action, which is mostly compiling customer data. This subprocess has all the same notations and format as a regular process.

        While this step isn’t necessarily vital information in the first onboarding map we saw, it is still important to include it in the final result. Adding it as a subprocess allows businesses to truly drill down to detail without the map becoming crowded. You can still fit your high-level process map on one page. 

        With Skore, businesses are able to have all the appropriate process steps and information accessible and visible without causing major confusion to anyone studying the map. 

        Process maps become easy for high-level C-suite conversations to follow along and make big decisions as needed, as all process details can be accessed and viewed instantly. If anyone needs any further information, you can quickly drill down as required. 

        Analytics

        Another aspect Skore offers is the integrated analytics that helps you figure out how and where to improve your existing, mapped processes.

        One of the goals of business process mapping is to improve or optimise your existing business.

        You can find places where you can be more efficient or cut costs. Find tasks that are redundant and are being duplicated by other departments or even tasks that can be removed, so your employees can dedicate themselves to other, more worthwhile pursuits.

        Taking the time to go over your processes and find the spots for improvement or optimisation is vital for any healthy business.

        The problem is the length of time these discussions can take, and the decisions that come after. These tend to be the meat of the argument when it comes time to actually act.

        So, how can you make this key part of process improvement go a bit faster?

        By relying on numbers and having a tool that helps you see them clearly.

        Enter Skore’s analytics.

        By inputting your information and data into the software and with a simple click of your mouse, the analytical dashboards are created. They will make your process improvement or optimisation decisions a lot faster. 

        And you’re not just relying on your gut instinct or the experience of your subject-matter experts – you’re relying on hard data and numbers. Which provides you with a much stronger business case to present to stakeholders. 

        In this, Skore is also unique, as the instant analytic functionality we have and offer our customers cannot be found with any other business improvement software.

        Roles and Responsibilities 

        Finally, at Skore we focus on clarity and simplicity when it comes to mapping out activities.

        This extends to who is in charge of each activity.

        Process documentation and the types of diagrams associated have not often given much room or emphasis to roles, responsibilities, and their associated accountabilities.

        This is a big problem and a mistake: if you don’t know which role is responsible for what action in your process, you do not know to whom you can ask questions.

        We place this focus on roles and their titles, as well as including a list of responsibilities associated with that role, and not on individuals. 

        Relying on individuals is risky, as employees will leave companies, and then take that knowledge with them. The last thing you want to do as a company is hiring someone back as an external contractor simply to go over how they made something run after they’ve left.

        With Skore, it becomes clear what role is responsible for what, meaning accountability is clear. 

        It’s much more effective at moving projects along as you can determine which role is directly responsible for each step of the process. There can’t be any internal disputes about who needs to meet the deadline when the associated role is there in black and white!

        Work levels can also be reported clearly with analytics tools, which is instrumental when it comes time to studying processes for improvement, as we saw above.

        Additionally, having roles responsible for certain tasks helps you understand how the process works in that instance. You have a clear title to ask questions when you’re first starting to map out the process, or when you start looking into improvement or optimisation.

        Conclusion 

        The above are only the top five reasons to switch or use Skore when it comes to business process mapping software.

        We’ve been looking to the future with a focus on user experience since our inception.

        Being early adopters of UPN, refocusing on roles and responsibilities, focusing on mapping quickly to ensure efficiency, and providing innovation to clients in the form of subprocesses and analytics.

        The truth is, there is no other tool out there in the market like us.

        So if you’re serious about taking the reins of your business and its processes, it’s time to have a call.

        Get in touch, and our team will be happy to walk you through everything you need!

        How Process Improvement Helps Cut Costs in the Food & Beverage Industry

        There is no shortage of challenges the food and beverage industry faces today.

        Challenges that come with rising industry costs and a more complicated world following a global pandemic.

        Food and beverage companies need to look at their existing processes to find ways to improve and optimise them if they want to spend less.

        How will that help?

        Let’s take a look.

        Challenges in the Food and Beverage Industry

        There are five distinct challenges in the food and beverage industry that organisations have to grapple with:

        Rising Costs

        Between a worldwide pandemic and a war, inflation is on the rise: food has increased by 15%. 

        Restaurants and food and beverage companies have faced huge losses as a result of both, and food prices have increased dramatically. 

        Between the effect of both worldwide catastrophes, the additional challenges on this list and the ever-changing environmental and climate condition, costs are increasing across the board. 

        Organisations in this industry are struggling to keep up, and are starting to tighten their grip on their spending.

        External Supply Chain Issues

        As with the above, the pandemic, the war, and climate change have had an enduring impact on supply chains around the world. After all, Russia and Ukraine provided nearly 30% of the world’s barley and wheat.

        During the pandemic, between panic buyers stockpiling food and workers not being able to go to work, supply chains around the world ground to a halt. While they are starting to recover, the amount of lean waste generated during this time is still being calculated. 

        Not to mention the ever-growing concern with cargo theft, which can cost businesses over 30 billion per year. And even if they recover their cargo, laws prohibit recovered food from being sold. So companies spend more on security to protect their cargo while also spending on moving it.

        Labour Shortage

        On top of the external issues affecting the industry, it is also one of the most affected by the Great Resignation.

        Not only are companies in the food and beverage industry losing key support staff and operations, but also important company knowledge. As workers move on from their positions, they take with them everything they learned while working for the company.

        Unless that knowledge has been retained, the most recent process is thus lost to company leadership.

        This slows down existing processes as remaining workers and leaders have to re-learn the process themselves, and it slows down training as you cannot justify hiring new workers until you know how to train them.

        Changing Customer Preferences and Expectations

        At the same time, customer preferences and expectations are undergoing a major shift.

        Modern buyers are a lot more in tune with their choices and their impact on themselves and the world around them. People are reading food labels, taking note of whether companies match their beliefs, whether the packaging is recyclable, and whether the products are made with renewable energy.

        Interest in healthier options and more varied international cuisine in an interconnected world requires food and beverage companies to be creative, resourceful, and mindful of customer tastes and interests, all of which have an additional cost at the moment. But it may well cost these companies a lot more in the future if they begin to lose customers.

        Quality Control and Compliance

        And finally, they have to adhere to some of the strictest rules and regulations out there.

        As food is something all humans require and can directly impact our health, the laws surrounding quality control and compliance leave no wiggle room. They are enforced quite strictly with regular audits to ensure the organisation is acting accordingly and respecting the ever-changing requirements of both the government and the public when it comes to health and sustainability.

        An additional cost for companies, those that do not find ways to adapt quickly and not bleed out money will be unlikely to make it through the next few years.

        Which begs the question – how is the food and beverage industry navigate these challenges?

        The answer lies in process improvement.

        Get Started Today

        The Role of Process Improvement in the Food and Beverage Industry

        Business process improvement and business process optimisation is the practice of visualising the way your business is run and finding spots where you can make changes for the better.

        In both instances, you are looking to make your business run more efficiently, and cutting costs or reducing practices that will negatively affect this.

        It is through studying their business processes that folks in the food and beverage industry can overcome the challenges they are currently facing.

        Let’s look at the labour shortage.

        In the UK, especially post-Brexit, there is a shortage of workers in this field. Business owners and farmers can map out their hiring process over time, and find spots that are overcomplicating the process. For instance, depending on the role, multiple interviews or a take-home assignment are probably unnecessary, thereby cutting your hiring window. 

        Additionally, you can compare how much it is costing you to post on different job boards and reduce costs by focusing only on the few that do provide you with candidates.

        When it comes to retention, process maps help you retain company knowledge about how things are done. Workers will always move on, but knowledge management of your business processes must be maintained in order to hire and successfully train new workers, avoid any significant slowdowns during employee turnover, and optimise your workforce even further. After all, by retaining your process knowledge, over time you find spots to improve and start doing more with less as you increase your efficiency. 

        In terms of the supply chain issues, you can map out how goods are delivered as a process, and then begin to research spots or ways to reduce costs. Reducing wait times, sourcing from alternative places, and hiring security teams for a longer stretch of time are all steps you can take that will help you keep costs down in the long run.

        When you seek alternative sourcing locations you can also keep in mind your consumer’s mindset and interests. Perhaps focusing on more ethical options will be more expensive at first, but pay itself out with higher consumer demand. Or it might even be more cost-effective from the very beginning, as it will also help you keep up with the quality control and compliance the industry requires.

        Visualizing how your processes are running helps you find these spots where you can make a change to improve your processes’ efficiency while simultaneously helping you cut costs. If you do not have a clear idea of how your business is being run, inflation will continue to grow and eventually you won’t be able to keep up.

        Understanding how your business is currently functioning has never been more important for the food and beverage industry.

        But how can you go about improving your processes?

        How Skore Helps Reduce Costs

        Our Skore platform was designed specifically with business process improvement in mind.

        Not only are you able to map out your processes in a clear, simple view, but you can retain information and knowledge for all workers thanks to our process libraries. It is also an entirely collaborative experience, simplified so that every person involved with a process, from stakeholders to front-line workers, can add and follow along during a workshop. 

        Its user focus also makes creating processes during a workshop faster than ever. And due to our standardised notation, everyone will be on the same page when it comes to meaning. No miscommunications happen when relying on Skore.

        Thanks to how easy it is to map processes through Skore, finding those improvement spots has become as easy as pie. Not only can data be added, visualized, and drilled down for multi-level processes, but Skore also has a unique data analysis dashboard that provides succinct information quickly to users.

        Through the data it is given, Skore’s Quantify Module specifically helps users analyse costs, systems, time, roles, compliance and quality checks, and process risks as they have been mapped. It will then help pinpoint the bottlenecks that result in your process slowing down and costing you precious time.

        The module also provides the possibility to model and see what your changes may impact before you take that step. After all, adding a step may cancel out the cost reduction you were imagining. On the other hand, it can be used for making a case for spending on technology or automation that will make you more efficient, as it will calculate how spending on this will save you money in the future.

        Other ways the module helps is by calculating the cost of services such as accounting to see if it makes sense to have it at the existing budget. Understanding capacity and calculating whether it is possible to make a change at this particular moment, exploring potential future scenarios and how they may impact your costs and revenue.

        Our clients at Skore have seen significant success with our tool when it comes to improving processes and thus cutting costs.

        From gaining a week’s worth of time off work back to expanding their business at the appropriate scale without overspending, they have met their organisational needs without compromising their budget.

        We’d love to help the food and beverage industry do the same.

        Conclusion

        It is a challenging time to be a leader in the food and beverage industry.

        There are significant hurdles to overcome due to the last few years, and it will not be easy.

        The best way to respond to these problems right now is to take control of your business and understand how it is running. From there, you will be able to find places to improve your processes, run a more efficient ship, and cut costs while increasing revenue opportunities in the future.

        All you have to do is set up a call with our team and we’d be glad to show you how.

        Get Started Today

        Responsive Menu
        Add more content here...
        Responsive Menu
        Add more content here...
        Responsive Menu
        Add more content here...
        Responsive Menu
        Add more content here...
        Responsive Menu
        Add more content here...
        Responsive Menu
        Add more content here...
        Responsive Menu
        Add more content here...
        Responsive Menu
        Add more content here...
        Responsive Menu
        Add more content here...
        Responsive Menu
        Add more content here...
        Responsive Menu
        Add more content here...
        Responsive Menu
        Add more content here...
        Responsive Menu
        Add more content here...
        Responsive Menu
        Add more content here...
        Responsive Menu
        Add more content here...
        Responsive Menu
        Add more content here...
        Responsive Menu
        Add more content here...
        Responsive Menu
        Add more content here...
        Responsive Menu
        Add more content here...
        Responsive Menu
        Add more content here...
        Responsive Menu
        Add more content here...
        Responsive Menu
        Add more content here...
        Responsive Menu
        Add more content here...
        Responsive Menu
        Add more content here...
        Responsive Menu
        Add more content here...
        Responsive Menu
        Add more content here...
        Responsive Menu
        Add more content here...
        Responsive Menu
        Add more content here...
        Responsive Menu
        Add more content here...
        Responsive Menu
        Add more content here...
        Responsive Menu
        Add more content here...
        Responsive Menu
        Add more content here...
        Responsive Menu
        Add more content here...
        Responsive Menu
        Add more content here...
        Responsive Menu
        Add more content here...
        Responsive Menu
        Add more content here...
        Responsive Menu
        Add more content here...
        Responsive Menu
        Add more content here...
        Responsive Menu
        Add more content here...
        Responsive Menu
        Add more content here...
        Responsive Menu
        Add more content here...
        Responsive Menu
        Add more content here...
        Responsive Menu
        Add more content here...
        Responsive Menu
        Add more content here...
        Responsive Menu
        Add more content here...
        Responsive Menu
        Add more content here...
        Responsive Menu
        Add more content here...
        Responsive Menu
        Add more content here...
        Responsive Menu
        Add more content here...
        Responsive Menu
        Add more content here...
        Responsive Menu
        Add more content here...
        Responsive Menu
        Add more content here...
        Responsive Menu
        Add more content here...
        Responsive Menu
        Add more content here...
        Responsive Menu
        Add more content here...
        Responsive Menu
        Add more content here...
        Responsive Menu
        Add more content here...
        Responsive Menu
        Add more content here...
        Responsive Menu
        Add more content here...
        Responsive Menu
        Add more content here...
        Responsive Menu
        Add more content here...
        Responsive Menu
        Add more content here...
        Responsive Menu
        Add more content here...
        Responsive Menu
        Add more content here...
        Responsive Menu
        Add more content here...
        Responsive Menu
        Add more content here...
        Responsive Menu
        Add more content here...
        Responsive Menu
        Add more content here...
        Responsive Menu
        Add more content here...
        Responsive Menu
        Add more content here...
        Responsive Menu
        Add more content here...
        Responsive Menu
        Add more content here...
        Responsive Menu
        Add more content here...
        Responsive Menu
        Add more content here...
        Responsive Menu
        Add more content here...
        Responsive Menu
        Add more content here...
        Responsive Menu
        Add more content here...
        Responsive Menu
        Add more content here...
        Responsive Menu
        Add more content here...
        Responsive Menu
        Add more content here...
        Responsive Menu
        Add more content here...
        Responsive Menu
        Add more content here...
        Responsive Menu
        Add more content here...
        Responsive Menu
        Add more content here...
        Responsive Menu
        Add more content here...
        Responsive Menu
        Add more content here...
        Responsive Menu
        Add more content here...
        Responsive Menu
        Add more content here...
        Responsive Menu
        Add more content here...
        Responsive Menu
        Add more content here...
        Responsive Menu
        Add more content here...
        Responsive Menu
        Add more content here...
        Responsive Menu
        Add more content here...
        Responsive Menu
        Add more content here...
        Responsive Menu
        Add more content here...
        Responsive Menu
        Add more content here...
        Responsive Menu
        Add more content here...
        Responsive Menu
        Add more content here...
        Responsive Menu
        Add more content here...
        Responsive Menu
        Add more content here...
        Responsive Menu
        Add more content here...
        Responsive Menu
        Add more content here...
        Responsive Menu
        Add more content here...
        Responsive Menu
        Add more content here...
        Responsive Menu
        Add more content here...
        Responsive Menu
        Add more content here...
        Responsive Menu
        Add more content here...
        Responsive Menu
        Add more content here...
        Responsive Menu
        Add more content here...
        Responsive Menu
        Add more content here...
        Responsive Menu
        Add more content here...
        Responsive Menu
        Add more content here...
        Responsive Menu
        Add more content here...
        Responsive Menu
        Add more content here...
        Responsive Menu
        Add more content here...
        Responsive Menu
        Add more content here...
        Responsive Menu
        Add more content here...
        Responsive Menu
        Add more content here...
        Responsive Menu
        Add more content here...
        Responsive Menu
        Add more content here...
        Responsive Menu
        Add more content here...
        Responsive Menu
        Add more content here...
        Responsive Menu
        Add more content here...
        Responsive Menu
        Add more content here...
        Responsive Menu
        Add more content here...
        Responsive Menu
        Add more content here...
        Responsive Menu
        Add more content here...
        Responsive Menu
        Add more content here...
        Responsive Menu
        Add more content here...
        Responsive Menu
        Add more content here...
        Responsive Menu
        Add more content here...
        Responsive Menu
        Add more content here...
        Responsive Menu
        Add more content here...
        Responsive Menu
        Add more content here...
        Responsive Menu
        Add more content here...
        Responsive Menu
        Add more content here...
        Responsive Menu
        Add more content here...
        Responsive Menu
        Add more content here...
        Responsive Menu
        Add more content here...
        Responsive Menu
        Add more content here...
        Responsive Menu
        Add more content here...
        Responsive Menu
        Add more content here...
        Responsive Menu
        Add more content here...
        Responsive Menu
        Add more content here...
        Responsive Menu
        Add more content here...
        Responsive Menu
        Add more content here...
        Responsive Menu
        Add more content here...
        Responsive Menu
        Add more content here...
        Responsive Menu
        Add more content here...
        Responsive Menu
        Add more content here...
        Responsive Menu
        Add more content here...
        Responsive Menu
        Add more content here...
        Responsive Menu
        Add more content here...
        Responsive Menu
        Add more content here...
        Responsive Menu
        Add more content here...
        Responsive Menu
        Add more content here...
        Responsive Menu
        Add more content here...
        Responsive Menu
        Add more content here...
        Responsive Menu
        Add more content here...
        Responsive Menu
        Add more content here...
        Responsive Menu
        Add more content here...
        Responsive Menu
        Add more content here...
        Responsive Menu
        Add more content here...
        Responsive Menu
        Add more content here...
        Responsive Menu
        Add more content here...
        Responsive Menu
        Add more content here...
        Responsive Menu
        Add more content here...
        Responsive Menu
        Add more content here...
        Responsive Menu
        Add more content here...
        Responsive Menu
        Add more content here...
        Responsive Menu
        Add more content here...
        Responsive Menu
        Add more content here...
        Responsive Menu
        Add more content here...
        Responsive Menu
        Add more content here...
        Responsive Menu
        Add more content here...
        Responsive Menu
        Add more content here...
        Responsive Menu
        Add more content here...
        Responsive Menu
        Add more content here...
        Responsive Menu
        Add more content here...
        Responsive Menu
        Add more content here...
        Responsive Menu
        Add more content here...
        Responsive Menu
        Add more content here...
        Responsive Menu
        Add more content here...
        Responsive Menu
        Add more content here...
        Responsive Menu
        Add more content here...
        Responsive Menu
        Add more content here...
        Responsive Menu
        Add more content here...
        Responsive Menu
        Add more content here...
        Responsive Menu
        Add more content here...
        Responsive Menu
        Add more content here...
        Responsive Menu
        Add more content here...
        Responsive Menu
        Add more content here...
        Responsive Menu
        Add more content here...
        Responsive Menu
        Add more content here...
        Responsive Menu
        Add more content here...
        Responsive Menu
        Add more content here...
        Responsive Menu
        Add more content here...
        Responsive Menu
        Add more content here...
        Responsive Menu
        Add more content here...
        Responsive Menu
        Add more content here...
        Responsive Menu
        Add more content here...
        Responsive Menu
        Add more content here...
        Responsive Menu
        Add more content here...
        Responsive Menu
        Add more content here...
        Responsive Menu
        Add more content here...
        Responsive Menu
        Add more content here...
        Responsive Menu
        Add more content here...
        Responsive Menu
        Add more content here...
        Responsive Menu
        Add more content here...
        Responsive Menu
        Add more content here...
        Responsive Menu
        Add more content here...
        Responsive Menu
        Add more content here...
        Responsive Menu
        Add more content here...
        Responsive Menu
        Add more content here...
        Responsive Menu
        Add more content here...
        Responsive Menu
        Add more content here...
        Responsive Menu
        Add more content here...
        Responsive Menu
        Add more content here...
        Responsive Menu
        Add more content here...
        Responsive Menu
        Add more content here...
        Responsive Menu
        Add more content here...
        Responsive Menu
        Add more content here...
        Responsive Menu
        Add more content here...
        Responsive Menu
        Add more content here...
        Responsive Menu
        Add more content here...
        Responsive Menu
        Add more content here...
        Responsive Menu
        Add more content here...
        Responsive Menu
        Add more content here...
        Responsive Menu
        Add more content here...
        Responsive Menu
        Add more content here...
        Responsive Menu
        Add more content here...
        Responsive Menu
        Add more content here...
        Responsive Menu
        Add more content here...
        Responsive Menu
        Add more content here...
        Responsive Menu
        Add more content here...
        Responsive Menu
        Add more content here...
        Responsive Menu
        Add more content here...
        Responsive Menu
        Add more content here...